As a business owner or marketer, it is important to understand your total addressable market (TAM), serviceable available market (SAM), and serviceable obtainable market (SOM) to gauge the size and potential of your business.

However, it can be challenging to obtain accurate and reliable data to determine these market sizes. This is where technographic data come into play. In this article, we will explain company technographics and how they can be used to determine TAM, SAM, and SOM.
Understanding TAM, SAM, and SOM at a Glance
Before we dive into how technographics can be used for TAM, SAM, and SOM, let’s first define these terms.
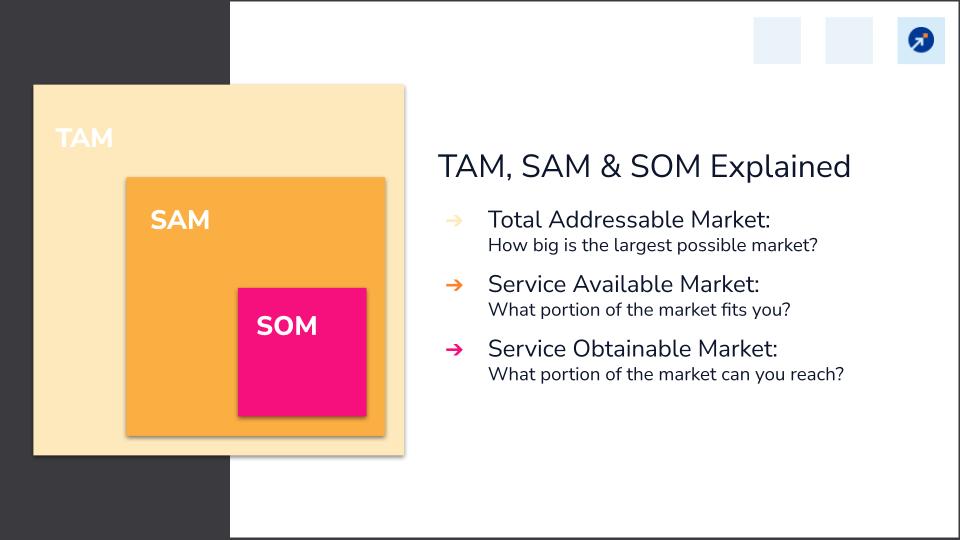
TAM refers to the total addressable market, the total market demand for a product or service. This is the maximum revenue a business could generate if it captured 100% of its potential market share.
SAM refers to the serviceable available market, the portion of the TAM that a business can realistically capture. This considers factors such as competition, geographic location, and market saturation.
SOM refers to the serviceable obtainable market, that is the portion of the SAM that a business can realistically capture based on its current resources and capabilities.
Explaining Company Technographics?
Company technographics refers to a set of data that provides insight into organizations’ technological capabilities and preferences. This data includes information on the hardware, software, and technology services used by a company, as well as their IT budget and priorities. Understanding a company’s technographics can help businesses identify opportunities to sell their products or services and target their marketing efforts more effectively.
Benefits of using Technographic Data for TAM, SAM, and SOM
Using technographic data can provide numerous benefits when determining TAM, SAM, and SOM. Here are a few examples:
Accurate data
One of the biggest advantages of using technographic data is that it provides accurate and reliable information on a company’s technology stack. This means that businesses can make more informed decisions when it comes to targeting their marketing efforts and identifying potential customers.
Competitive analysis
Technographic data can also be used to conduct competitive analysis. By understanding the technology stack of your competitors, you can identify gaps in the market and opportunities to differentiate your product or service.
Improved sales targeting
Technographic data can help businesses identify companies most likely to be interested in their products or services. By targeting companies with a specific technology stack, businesses can increase the likelihood of making a sale.
Company Technographics vs. Traditional Targeting Methods
One of the main advantages of using technographic data for targeting is its ability to provide more accurate and specific insights into a company’s technology stack. This information can be used to create more targeted and effective marketing campaigns.
On the other hand, traditional targeting methods, such as demographic targeting, are based on generalizations and assumptions about a group of people. While these methods can be effective, they are not as precise as technographics and can lead to wasted resources on ineffective marketing efforts.
How to Use Technographic Data for TAM, SAM, and SOM
Now that we understand the benefits of using technographic data, let’s discuss how it can be used to determine TAM, SAM, and SOM.
Identify your target market
The first step in using technographic data is to identify your target market. This includes identifying the industries and companies that are most likely to be interested in your products or services.
Collect technographic data
Once you have identified your target market, the next step is to collect technographic data on those companies. This can be done using a variety of tools and resources, which we will discuss later in this article.
Analyze the data
After collecting the technographic data, the next step is to analyze it to determine the technology trends and preferences of your target market. This can help you identify opportunities to differentiate your product or service and target your marketing efforts more effectively.
Determine TAM, SAM, and SOM
To more accurately determine your total addressable market, use company technographic data. Data on technology usage can help identify which businesses use particular technologies and give you a profile of those businesses. Then you can determine which other businesses meet the same requirements and combine that information with firmographic information (size, revenue, location, etc.). When combined with data models that include technographic data, your market analysis is more precise and comprehensive.
Targeting New Potential Customers Using Company Technographics
For instance, a B2B software company can use company technographics to target companies using a competitor’s software. By identifying these companies and creating targeted campaigns that address the gaps in their current software, the company can convert these companies into customers.
Another example is a campaign by a cybersecurity company that can use technographic data to target companies using outdated security software. By identifying these companies and creating targeted campaigns that address their security concerns, the company can generate new leads and customers.
Many companies already use technographic data to determine TAM, SAM, and SOM. For example, Salesforce uses technographic data to identify potential customers and personalize its marketing efforts. HubSpot uses technographic data to identify the technology trends of its target market and create content that resonates with its audience.
Challenges Using Technographic Data for TAM, SAM, and SOM
While technographic data can provide numerous benefits, there are also some challenges. Here are a few examples:
Data Accuracy
One of the biggest challenges in using technographic data is ensuring that the data is accurate and reliable. This can be difficult, as companies may not always be forthcoming about their technology stack.
Data Availability
Another challenge is ensuring that the data is available for the companies you are targeting. Some smaller or less tech-savvy companies may not have their technology stack publicly available, making it difficult to collect accurate data.
Data Analysis
Analyzing technographic data can be challenging, especially for businesses that still need a dedicated data analysis team. This can require significant time and resources to ensure that the data is being used effectively.
Best Practices for Using Technographic Data for TAM, SAM, and SOM
To ensure that you are using technographic data effectively, here are a few best practices to consider:
Use Multiple Sources
To ensure your data is accurate and reliable use multiple sources when collecting technographic data. This can help you identify any inconsistencies and ensure that you are making informed decisions.
Keep Data Up-To-Date
Technographic data can quickly become outdated as technology trends change rapidly. Keep your data up-to-date to ensure that you make informed decisions based on current trends and preferences.
Use Data To Inform Decisions
Finally, remember to use technographic data to inform your decisions rather than as the sole source of information. By combining technographic data with other sources, such as customer feedback and market research, you can make more informed decisions about your business.
Using SalesIntel for TAM, SAM, SOM
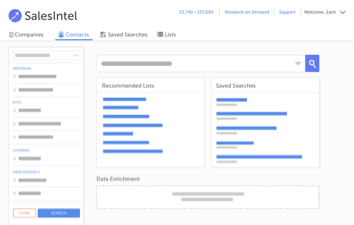
SalesIntel can help in determining the Total Addressable Market (TAM), Serviceable Available Market (SAM), and Serviceable Obtainable Market (SOM) by providing valuable insights into customer behavior, preferences, and buying patterns.
Here’s how sales intelligence can help in each of the three market sizing categories:
Total Addressable Market (TAM):
SalesIntel can help you identify the total potential market size for your product or service by providing data on the number of potential customers, their location, industry, and other relevant demographics. This information can help you estimate market size and potential revenue opportunities.
Starting with Your Total Addressable Market
Consider that you are marketing a digital marketing tool. Technically, you could have any type of customer anywhere in the world.
TAM = (annual revenue per customer/contract) x (number of total possible customers/contracts).
Your ACV (annual contract value) multiplied by the number of potential customers would be your TAM. SalesIntel provides us with more than 1 million companies and more than 1 million potential contacts if the only restriction on our search is the presence of marketing or sales leadership at the company. That’s an exciting amount of people you could go after.
Serviceable Available Market (SAM):
You can identify the portion of the TAM that you can realistically target and serve. This includes customers who need your product or service and have the budget and resources to purchase it. SalesIntel can help you identify the specific market segments where your product or service is most relevant and valuable.
Narrowing Down to SAM
Account-product fit based on technographics, firmographics, scale, and persona-product fit based on titles, teams executives, budget holders, and all-time ACV (annual contract value) are the components of the SAM formula. How many personas and accounts do you think would fit your ideal marketing product?
Assume you want the US Market, 10 to 1,000 employees, sales, marketing or RevOps leadership, and still any vertical, but with a CRM and cadence tool. If we pop those criteria into SalesIntel, we get 72K companies and 257K contacts. We’re down to 1/15 of the TAM size and starting to look at a more reasonable number of companies to be chasing. At least you won’t try to fit a million contacts into your CRM.
Serviceable Obtainable Market (SOM):
SalesIntel can help you identify the portion of the SAM you can realistically capture and convert into customers. This includes customers who are actively looking for a solution to their problem and are willing to engage with your company. SalesIntel helps you identify specific buying triggers, pain points, and decision-making processes of target customers, which can help you refine your sales and marketing strategies to maximize your conversion rate.
Setting Expectations with SOM
We can perform your SOM calculation and provide a targeted list. You’ll not only have a model for predicting revenue, but you’ll also be able to prioritize the deals you think have the best chance of success. To launch your sales and marketing initiatives, you can pull a contact list from a B2B database that perfectly matches your ICP.
SalesIntel offers the best data quality with 90-day re-verification to ensure the best, most reliable TAM, SAM, and SOM analysis results.
SalesIntel can provide valuable insights into market trends, the competitive landscape, customer behavior, and buying patterns. Our data can help you make informed decisions about your TAM, SAM, and SOM and develop effective sales and marketing strategies to grow your business.
Company Technographics Data Is a Game Changer in 2024
Company technographics provide valuable insight into the technology trends and preferences of your target market. By using technographic data to determine TAM, SAM, and SOM, businesses can make more informed decisions about their market potential and target their marketing efforts more effectively.
While there are some challenges to using technographic data, by following best practices and combining technographic data with other sources, businesses can make more accurate predictions about their market potential and improve their overall business strategy.
Want to identify new market opportunities for your team? Take a detailed SalesIntel demo tailored to your ICP.


