

A quick AI-generated overview extracted directly from the content of this page.
In the pursuit of growth, many businesses sell into the accounts already in their CRM and marketing automation systems, oblivious to a large number of suitable prospects not in their data. You should always want to know the number of companies that can be successful with your product or service and what revenue these potential customers can generate you–your total addressable market.
Understanding your total addressable market is crucial to set realistic revenue goals and enter only those markets with the best potential to invest your time and resources.
In this article, you will learn more about:
- What is the Total Addressable Market?
- Why Calculating the TAM is Important
- 3 Mistakes Businesses Make When Defining TAM
- How to Calculate Total Addressable Market
- Xerox’s TAM Miscalculation: The Missed PC Revolution
- Modern Ways to Calculate TAM
What is the Total Addressable Market?
Total Addressable Market (TAM) refers to the total market demand for a product or service, calculated in annual revenue or unit sales if 100% of the available market is captured. It represents the maximum potential size of a market if a company could serve all possible customers with its offering.
Key points about TAM:
- Encompasses all potential customers and revenue opportunities
- Typically expressed as a dollar value or total number of customers
- Represents a theoretical maximum, not a realistic sales target
- Can be global or limited to specific geographic regions or customer segments
The importance of understanding TAM for business growth.
- Strategic planning:
- Helps set realistic growth targets
- Guides resource allocation and investment decisions
- Informs market entry and expansion strategies
- Investor relations:
- Demonstrates market potential to investors and stakeholders
- Supports fundraising efforts by showing growth opportunities
- Product development:
- Identifies untapped market segments
- Guides feature prioritization based on market needs
- Competitive analysis:
- Provides context for your current market share
- Helps identify potential competitors and market gaps
- Marketing and sales:
- Informs targeting and positioning strategies
- Helps in estimating customer acquisition costs and lifetime value
- Risk assessment:
- Evaluates market saturation and potential for growth
- Identifies external factors that may impact market size
- Performance benchmarking:
- Provides a baseline for measuring company performance
- Helps in setting and tracking key performance indicators (KPIs)
Understanding your TAM allows you to make data-driven decisions, allocate resources effectively, and identify the most promising growth opportunities for your business.
What is TAM, SAM, and SOM?
TAM (Total Addressable Market)
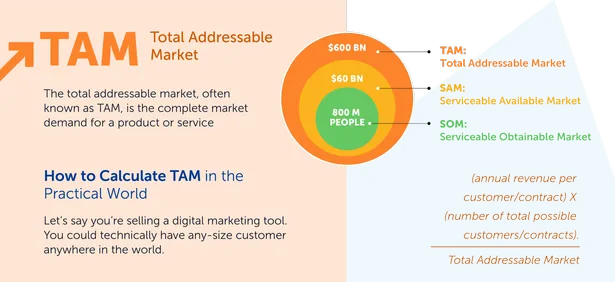
The total addressable market, often known as TAM, is the complete market demand for a product or service. It is the maximum amount of money a company may produce by selling its product or service in a specific market
Most businesses, unless they have a monopoly, are unable to capture the complete addressable market for their product or service. Even if a firm just has one competitor, convincing an entire market to acquire their product or service would be incredibly tough.
As a result, most businesses assess their viable addressable market to estimate how many clients they can realistically reach through their marketing and sales channels. They also assess their market share to determine the size of their real target market.
However, the total addressable market (TAM) is still valuable since firms may use TAM to objectively predict the potential for growth of a certain industry.
SAM (Serviceable Addressable Market)
You will most likely be unable to service your complete addressable market due to the limits of your company strategy (such as specialty or regional limitations).
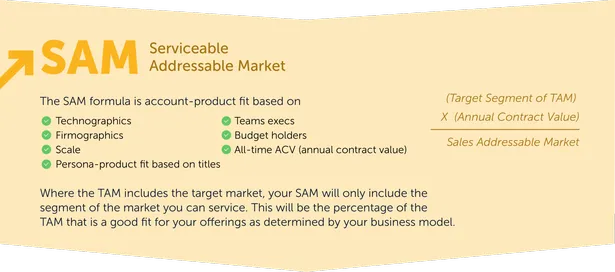
The serviceable addressable market is most important for organizations in determining their objectives by objectively estimating the percentage of the market they can capture.
SOM (Serviceable Obtainable Market)
You are unlikely to be able to capture 100% of your serviceable addressable market. Competitors, alternative approaches, and those uninterested in buying any solution all take a bite out of the customers available. That’s why it is critical to assess your viable available market to discover how many clients will profit practically from purchasing your product or service.
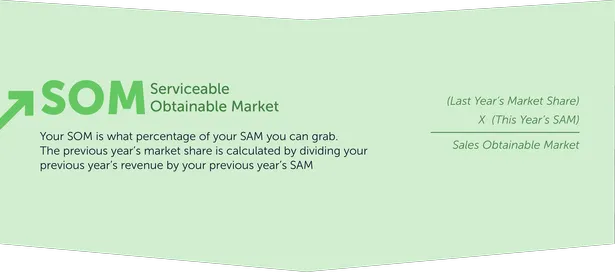
The market for Serviceable Obtainable is particularly valuable for organizations in determining short-term growth ambitions.
Read About – TAM SAM SOM
Why Calculating the TAM is Important
The Total Addressable Market is a key measure to evaluate the market’s potential size in terms of total sales and revenues. TAM is useful when a company is in the midst of delivering a new product, a new consumer group, or a plan to cross-sell an existing product to existing customers. An investor should be realistic in analyzing the available market because an exaggerated value can lead to markets with lower growth potential. A market with growth potential is ideal for any entrepreneur.
Total Addressable Market (TAM) analysis plays a crucial role in shaping business strategy and operations. Let’s explore how TAM informs key areas of business decision-making:
Strategic Decisions:
- Market Entry:
- TAM helps determine if a market is large enough to justify entry
- Identifies potential barriers to entry and competitive landscape
- Guides decisions on timing and scale of market entry
- Product Development:
- Prioritizes features based on market demand and size
- Identifies opportunities for new product lines or services
- Informs decisions on customization vs. standardization
- Geographic Expansion:
- Compares TAM across different regions to prioritize expansion efforts
- Helps in understanding local market dynamics and potential
- Partnerships and Acquisitions:
- Evaluates potential partners or acquisition targets based on their market position
- Assesses synergies and combined TAM post-partnership or acquisition
Investment Allocation:
- R&D Spending:
- Aligns R&D budgets with market potential
- Justifies investments in innovation for larger market opportunities
- Marketing and Sales Resources:
- Determines appropriate marketing spend based on market size
- Guides sales team structure and territory planning
- Infrastructure and Capacity:
- Informs decisions on production capacity and infrastructure investments
- Helps in planning for scalability based on market potential
- Technology and Digital Transformation:
- Prioritizes tech investments based on market demands and size
- Guides decisions on platform development and digital initiatives
Market Positioning:
- Target Audience Definition:
- Helps identify and prioritize customer segments within the TAM
- Guides development of buyer personas and ideal customer profiles
- Competitive Differentiation:
- Identifies market gaps and underserved segments
- Informs unique selling propositions (USPs) and value propositions
- Pricing Strategy:
- Helps determine pricing based on market size and competitive landscape
- Guides decisions on premium vs. volume-based pricing approaches
- Brand Positioning:
- Shapes brand messaging to resonate with the largest or most valuable segments of the TAM
- Informs decisions on brand extensions or repositioning
- Go-to-Market Strategy:
- Determines appropriate channels based on TAM characteristics
- Guides decisions on direct sales, partnerships, or marketplace approaches
Risk Management:
- Diversification:
- Informs decisions on entering multiple markets to spread risk
- Guides product diversification based on TAM analysis of adjacent markets
- Scenario Planning:
- Helps in creating best-case, worst-case, and most likely market scenarios
- Informs contingency planning and risk mitigation strategies
By leveraging TAM analysis, businesses can make more informed decisions, allocate resources efficiently, and position themselves effectively in the market. This data-driven approach increases the likelihood of success and sustainable growth.
What Is TAM in Sales
Total Addressable Market (TAM) is a term used in sales and marketing to refer to the total potential revenue that a product or service could generate if all potential customers were to purchase it. It is a measure of the size of a market and is often used to help determine the potential success of a product or service.
TAM is calculated by multiplying the total number of potential customers by the average revenue per customer. The TAM is a key metric used in Business Modeling, Market Sizing and Sales Forecasting to predict the future revenue potential of a product or service, it’s also an important metric to help companies determine their growth potential and set realistic sales goals.
Accessible Market vs Addressable Market
An accessible market refers to the total number of potential customers that a company can reach through its marketing efforts. An addressable market, on the other hand, refers to the portion of the accessible market that is interested in and willing to purchase the company’s products or services. In other words, the addressable market is a subset of the accessible market and represents the actual target market for a company.

3 Mistakes Businesses Make When Defining TAM
Several common errors can result in an inaccurate grasp of your TAM. Here are three frequent blunders made by businesses:
1. Confusing TAM, SAM, and SOM
The total addressable market (TAM) is often confused with the serviceable available market (SAM) and the serviceable obtainable market (SOM). Differentiating between these is crucial to preventing this misunderstanding in your business.
SAM represents the segment of the TAM that is accessible to a company based on its existing resources and capabilities. For instance, consider a project management software available only in English and tailored for businesses with under 30 employees. Your SAM would be the portion of the TAM that meets these criteria, specifically English-speaking businesses with fewer than 30 employees.
SOM, on the other hand, delves further into the SAM, reflecting the portion realistically attainable by a company. Typically smaller than SAM, SOM factors in elements like competition, pricing, existing demand, and the appeal of your product or service. For instance, if five established competitors exist in the market, your product is priced at a premium, and there’s minimal demand due to market saturation, your SOM would likely be limited. These factors make it challenging to secure a substantial market share.
2. Not segmenting the market
Businesses often stumble by neglecting to segment their market while defining their TAM. The overall addressable market for a product or service consistently surpasses the market within a particular segment.
For instance, consider the global market for project management software, encompassing software aiding businesses in project management. However, the market shrinks significantly when narrowing it down to project management software tailored for small businesses in the United States. Further, the market size decreases even more when focusing on small businesses in the United States, specifically within the construction industry.
Segmenting the market is pivotal as it provides a more precise grasp of the targeted market size and the potential business prospects within that particular segment.
3. Not taking into account future growth
Many businesses make the mistake of defining their TAM by solely focusing on the present and disregarding future growth potential.
For instance, suppose your project management software caters exclusively to businesses with fewer than 30 employees and is only accessible in English. If you limit your consideration to the portion of the TAM constrained by these factors, you overlook your business’s future growth trajectory.
To obtain a more precise TAM assessment, it’s vital to incorporate factors such as expansion plans into new markets, introducing features to broaden accessibility across a broader spectrum of businesses, and other strategies for future scalability and enhancement. Incorporating these elements offers a more comprehensive and accurate understanding of your TAM.
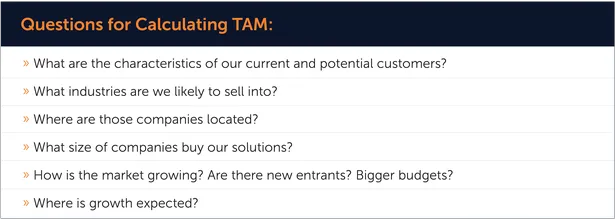
How to Calculate Total Addressable Market?
There are three methods to calculate TAM:
- Top-down, using industry research and reports.
- Bottom-up, using data from early selling efforts.
- Value theory is based on assumptions about customer willingness to pay.
1) Top-down
A Top-Down analysis starts with the highest size estimate possible and reduces it using data and assumptions about your company and industry. In a top-down approach, TAM is determined using industry data, market surveys, and research studies.
You can use Gartner or Forrester industry statistics to determine which subsections of your market meet your aims and offers – and how big those subsections are – as part of this plan.
There are some restrictions. Data from industry associations are not always up to date and may not adequately reflect your market’s specific characteristics. You might employ a market research consulting firm to conduct a new study tailored to your specific requirements. This is frequently the least preferred method to frame a TAM discussion. It contains relatively little information and is reliant on web reporting and data.
When there are mixed pricing structures (for example, a software section shifting from license to SaaS pricing), the study becomes more complicated. When a founder delivers a number from an external source, the natural assumption is that they did some Googling when preparing the deck and discovered a number large enough to get the job done.
However, it is assumed that the company’s disruptive product will not have a significant impact on the TAM. Too many pitches utilize industry TAM statistics and then claim about undercutting incumbent pricing by 50% or more. Consider if you saw a proposal for an online encyclopedia in 1999, and the TAM was framed by sales of printed encyclopedias. In reality, internet encyclopedias significantly reduced that TAM.
2) Bottom-up
The bottom-up approach is based on previous sales and pricing data. Divide your average sales price by the number of current clients. This is the yearly worth of your contract. Then, divide the value of your annual contract by the number of clients. As a result, your total addressable market will be calculated. Let’s have a look at an example of this.
In an ideal world, the corporation can carefully explain why certain businesses will utilize its service while excluding those who are unlikely to. A mid-market provider, for example, might utilize employment information to determine how many people work at organizations with 100-5,000 employees and then adjust for blue/white collar mix if it mostly sells to white-collar firms.
This transforms the TAM debate from a basic statement of industry size to a much more fascinating discussion: the breadth of potential product-market fit. Instead of being an unarguable statistic, the TAM number is based on assumptions about the types of clients the company can serve and win.
For example, a company might illustrate the breadth of its present customer base in terms of sectors and geographies as proof that the product works globally. And then, they explain how the product roadmap would gradually take it up-market or into other verticals, each with a matching TAM estimate.
3) Value-theory
Value theory focuses on adding value, especially how to add value and reasons that help you capture the market. A theory of values TAM is based on an assessment of the value delivered by the product to a group of consumers and a guess of how much of that value creation may be collected through price.
This method frequently comes to the fore when a company considers extending its main product and cross-selling to current clients as part of a long-term plan.
This way of estimating is excellent for determining the TAM for new features, updates to current goods, or for introducing a novel product that will effectively create its own category. To apply this strategy, consider what customers find useful and how much they are ready to pay for that value. Then you must estimate how many buyers will find that level of value in the product and pick it over alternatives.
Xerox’s TAM Miscalculation: The Missed PC Revolution
In the 1970s, Xerox, a leading company in photocopiers and document management, developed the Xerox Alto, one of the earliest personal computers. The Alto was a groundbreaking invention, featuring a graphical user interface, a mouse, and the capability to network with other computers—a remarkable innovation far ahead of its time.
However, Xerox failed to assess the potential market size for personal computers accurately. At that time, their primary revenue came from photocopiers and document-related products. Unlike their thriving copier business, they underestimated computer demand, presuming it to be a niche market.
Xerox’s conservative estimation of the Total Addressable Market (TAM) for personal computers led them to produce only a limited number of Alto units. They primarily focused on research and development rather than aggressively pursuing the commercialization and widespread adoption of this new technology.
Meanwhile, competitors like Apple and Microsoft recognized the broader potential of personal computing. Apple introduced the Apple II in 1977, a more user-friendly and commercially viable personal computer, while Microsoft focused on developing software for these computers.
Xerox’s oversight in assessing the TAM for personal computers became evident as the demand for PCs surged in the 1980s and beyond. The company’s lack of faith in the market’s potential meant they didn’t capitalize on their innovative technology. They didn’t market or distribute the Alto extensively, missing the chance to establish themselves as a dominant force in the emerging personal computing industry.
Ultimately, Xerox’s underestimation of the TAM for personal computers resulted in missed opportunities for growth and innovation. Competitors seized the market, and Xerox’s groundbreaking technology didn’t achieve the impact it could have had they accurately gauged the market demand and potential for personal computing. This historical case underscores the significance of correctly assessing the TAM to capitalize on innovation and market opportunities.
Pitfalls to Avoid When Calculating TAM
Calculating your TAM is critical for developing a long-term strategy for your sales, marketing, and organization. If you don’t do it right, you can end up losing your invested time, effort, and money.
Two major traps to avoid while measuring TAM are as follows:
1. The size of an issue does not always correspond to the size of a market:
Problems do not necessarily elicit a desire for a solution. Companies will not always pay for a solution to their difficulties. For example, even if your product saves consumers money, saves time, or increases team effectiveness, it may be tough to persuade prospects to buy it if they already have a dependable and proven (though inefficient) current option.
2. Wrong assumptions about prior markets:
Decisions based on inaccurate assumptions result in money being lost. Businesses can’t afford to build go-to-market plans based on guesswork now that adoption, use, and expenditure data are accessible.
Modern Ways to Calculate TAM
TAM might be challenging to quantify since it is a forecasting metric rather than one based on qualifying demand or events in a pipeline.
Modern data analytics technologies can help with this. A company’s TAM is more accurate when it includes data on present customers in an industry, how much they spend on similar solutions, how much more effort they have to spend, and how to capture these potential target accounts using the ABM funnel.
TAM was formerly calculated using firmographic data like revenue, company size, region, and so on. These characteristics, although essential, are restricted.
Executives need to know how customers will use your product in their technology environment and when they will need it, not just who. Intent and technographic information give more insight into need, buying interest, and integrations.
Suppose you are selling a CRM. Now, if your CRM can easily integrate with the Zoho email campaign tool, then companies using Zoho are your low-hanging fruits. Here’s when technographic data comes into play. Going a step forward, companies using Zoho must be looking for a CRM that can integrate with their email marketing tool. You can identify those using technographic + Buyer Intent data.
Given that, along with firmographic data, technographic data and buyer intent data are the two most crucial insights to calculate your TAM. Modern data platforms can offer this information.
Check this detailed infographic –
Using SalesIntel for Calculating Data-Driven TAM
Businesses are frequently forced to choose between data quality and data quantity. Data quality enables you to perform the most effective outreach, with targeted content, to the correct decision-makers at firms that are ready to buy now. Data quantity, on the other hand, levels the playing field for identifying more chances to create more leads and establish a larger pipeline.
We realize how important it is for your sales staff to have both accuracy and quantity. As a result, SalesIntel enables you to identify and reach millions of decision-makers from IT, Education, Finance and Banking, Recruitment, Professional Services, and other industries.
Additionally, SalesIntel delivers technographic, firmographic, and buying intent data to filter organizations based on the technologies they employ, company size, geography, buying intent signals, and other factors.
Read About – Zoominfo Cost Comparison
FAQs
What is Total Addressable Market (TAM)?
TAM represents the maximum revenue opportunity available if your product captured 100% of the entire market. It defines universal market demand regardless of competition or your current capabilities, helping you assess overall market potential and long-term growth prospects.
Why is Accurate TAM Calculation Important?
Accurate TAM calculation guides strategic planning, investment decisions, and growth targets by providing a realistic view of market potential. Without precise TAM data, you risk misallocating resources, misjudging market entry timing, and building products for markets that are too small to sustain your business.
What are the differences between TAM, SAM, and SOM?
TAM is the total market if you captured 100% share. SAM (Serviceable Available Market) is the portion you can reach with your current offerings. SOM (Serviceable Obtainable Market) is what you can realistically capture. These metrics help set achievable growth targets and understand your true market opportunity.
What are the methods for calculating TAM?
The three main approaches are top-down (using industry reports and market research), bottom-up (aggregating customer data and projecting from leads), and value theory (estimating based on customer value created). Combining multiple methods provides the most robust and accurate calculation.
What are the steps for conducting a TAM analysis?
Define your target market and product scope clearly, then gather data from sales figures, market research, and industry reports. Apply multiple calculation methodologies to estimate total revenue potential, then validate your findings and adjust for market nuances and future trends.
Why is it recommended to combine multiple approaches for TAM calculation accuracy?
Each calculation method has strengths and weaknesses. Combining approaches lets you triangulate estimates, cross-validate data, and reduce bias from any single method. This gives you a more comprehensive, reliable understanding of true market potential.
What are the best practices for accurate TAM calculation?
Start with clear market definitions and segmentation. Use multiple methodologies and cross-reference data sources with reliable market intelligence. Continuously validate and update calculations to reflect market changes, and involve cross-functional teams for diverse perspectives and holistic insights.
What pitfalls should be avoided when calculating TAM?
Don’t rely on outdated data or overly broad market definitions. Avoid confusing TAM with current revenue or being overly optimistic about market penetration. Account for competitive factors, new technologies, and regulations. Focus on granular, verifiable data rather than assumptions.
Why is continuous validation and updating of TAM calculations important?
Markets constantly change due to new technologies, economic shifts, competition, and evolving customer needs. Regular updates keep your market understanding current, enabling agile strategic adjustments, informed resource allocation, and sustained competitive advantage.
Can external research be used for TAM calculation?
Yes, external research is essential for accurate TAM calculation. Industry reports, market studies, government statistics, and competitive analysis provide valuable data points. External sources help validate internal assumptions, identify emerging trends, and offer broader perspective on market size and potential.